
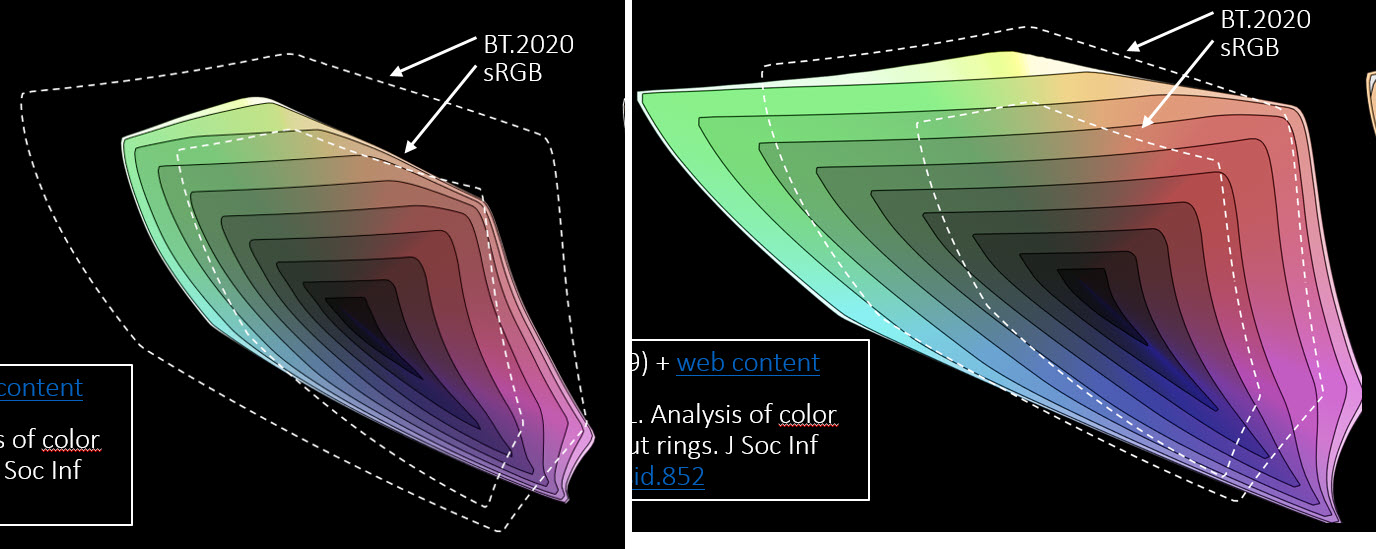
Although a chromaticity diagram is useful for 2D representations, the color gamut of a display actually needs to be evaluated using a 3D color space that includes the lightness axis. Gamut rings representing a 3D color gamut solid using a 2D diagram are a solution to this problem and have been adopted as an international standard and can be used in the design and evaluation of printers and displays.
In the CIE 1931 chromaticity charts below, the two displays look nearly identical. Gamut rings show that while display A can’t even cover all of sRGB, display B nearly covers rec.2020.
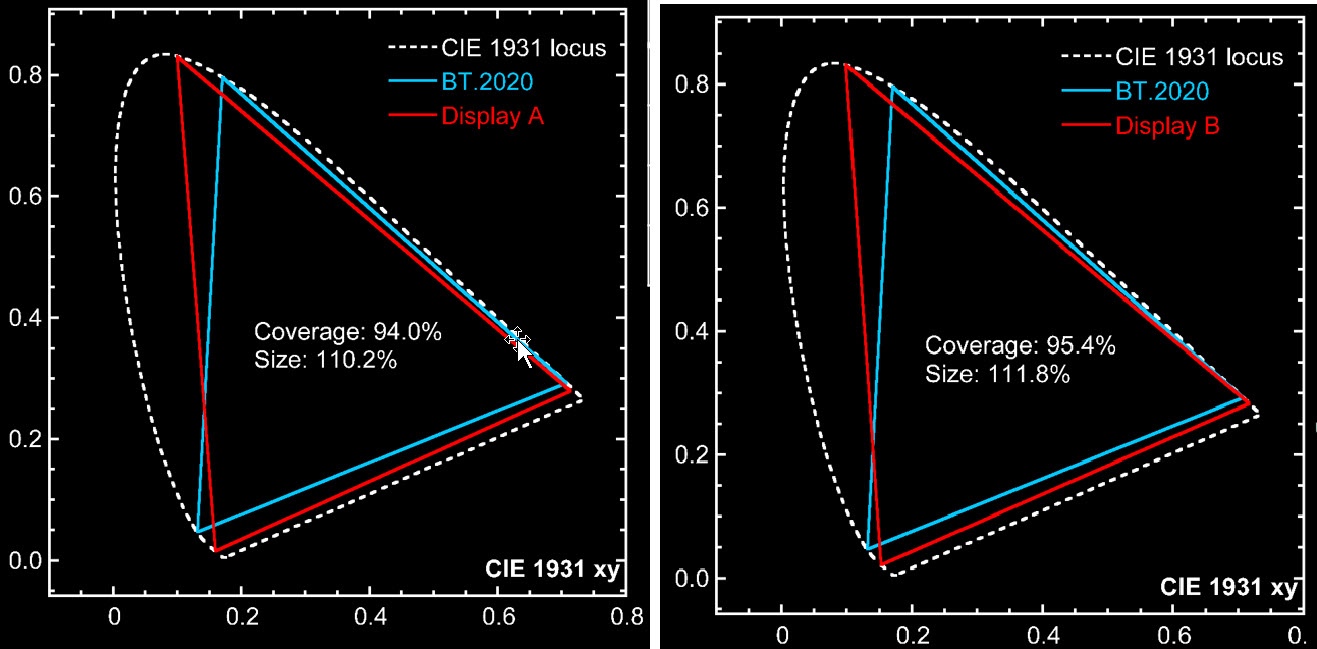
A correspondent told Bob Raikes of Display Daily “We’ve found real-world examples of projectors or displays that measure within 1% of each other in chromaticity area coverage and yet are off by 100% in color volume.”
Something to think about the next time you hear someone say their WRGB OLED covers 96% of P3!

Yeah, 96% of P3 is basically Rec709 🙂
😂